Moving Averages Explained: SMA vs EMA and How Traders Use Them
A simple moving average weights every price equally; an exponential moving average gives recent prices more weight, so it turns faster. Learn both formulas and how traders use them.
In this guide
- What Is a Moving Average?
- Simple Moving Average (SMA) Formula
- Exponential Moving Average (EMA) Formula
- SMA vs EMA: A Worked Calculation
- Moving Average vs Exponential Moving Average: Key Differences
- The 50 and 200 Day Moving Average
- Moving Average Crossover Strategies and the Whipsaw Problem
- A Moving Average Strategy for Beginners
- What the Research Says
- Bottom Line
- Sources
The difference between a moving average vs exponential moving average comes down to weighting. A simple moving average (SMA) adds up the last N closing prices and divides by N, so every day counts equally. An exponential moving average (EMA) gives the most recent prices more weight, so it turns faster when price changes direction, at the cost of more false signals.
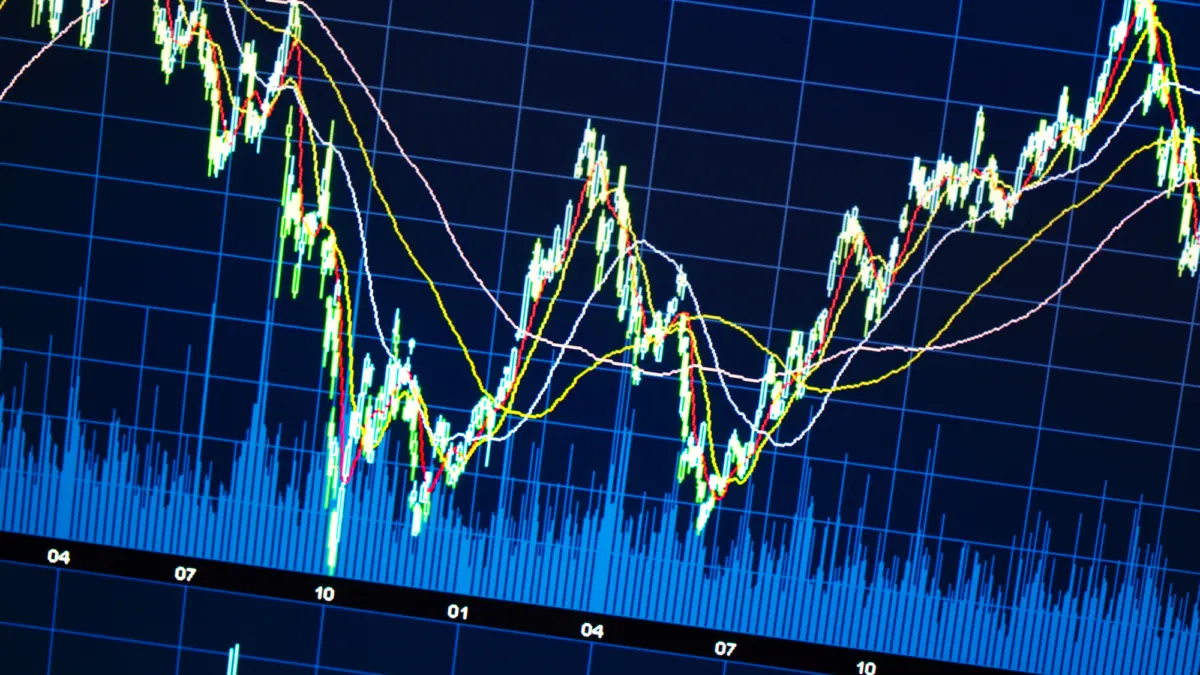
Both lines smooth out day-to-day noise so you can see the trend, and both are built into every charting platform. Traders use them as trend filters, as moving support and resistance, and as the basis for crossover signals such as the golden cross.
This guide shows the formula for each with a small worked calculation, explains lag, covers the 50- and 200-day averages, and looks honestly at crossover strategies and their biggest weakness: whipsaws.
What Is a Moving Average?
A moving average is the average price over a fixed number of recent periods, recalculated each period as the window “moves” forward. On a daily chart, a 20-day moving average plots one point per day, each equal to the average of the previous 20 closes.
Moving averages answer one question well: which way is price trending, on average, over this window? A rising average with price above it describes an uptrend. A falling average with price below it describes a downtrend. A flat average with price weaving through it describes a range.
They are among the most common tools in technical analysis, and several other indicators, including the MACD indicator, are built directly from them.
Simple Moving Average (SMA) Formula
The SMA is the arithmetic mean of the last N closing prices:
SMA = (P1 + P2 + … + PN) ÷ N
Here P1 to PN are the last N closing prices.
Each new period, the oldest price drops out and the newest is added. Every price in the window carries the same weight: in a 5-day SMA, each close counts for 20%; in a 200-day SMA, each counts for 0.5%.
Equal weighting has a side effect called the drop-off effect. The SMA can move because of the price that just left the window, not the one that arrived. A big move from 20 days ago can tug a 20-day SMA today, even if nothing happened today.
Exponential Moving Average (EMA) Formula
The EMA is calculated recursively, using yesterday’s EMA and a smoothing multiplier:
Multiplier (k) = 2 ÷ (N + 1)
EMA today = (Close today − EMA yesterday) × k + EMA yesterday
Put another way, the EMA moves a fraction k of the distance toward today’s close. For a 5-period EMA, k = 2 ÷ 6 ≈ 0.333; for a 10-period EMA, k = 2 ÷ 11 ≈ 0.182; for a 50-period EMA, k = 2 ÷ 51 ≈ 0.039; and for a 200-period EMA, k = 2 ÷ 201 ≈ 0.010.
Because each EMA value includes the previous one, every past price keeps a small and shrinking weight. In a 5-period EMA, the latest close carries about 33% of the weight, the one before about 22%, then about 15%, 10% and 7%. Those five closes add up to roughly 87%; older prices share the remaining 13%.
The first EMA value needs a starting point. The usual convention is to seed it with the SMA of the first N closes. That is why EMA values can differ slightly between platforms that start from different dates.
SMA vs EMA: A Worked Calculation
Example: Suppose a stock closes at $50, $51, $53, $52 and $54 over five days.
5-day SMA on day 5: ($50 + $51 + $53 + $52 + $54) ÷ 5 = $260 ÷ 5 = $52.00. We also use this as the starting 5-day EMA.
Day 6, close $57.
- SMA: drop $50, add $57. ($51 + $53 + $52 + $54 + $57) ÷ 5 = $267 ÷ 5 = $53.40.
- EMA: ($57 − $52.00) × 0.3333 + $52.00 = $1.67 + $52.00 = $53.67.
Day 7, close $52.
- SMA: drop $51, add $52. ($53 + $52 + $54 + $57 + $52) ÷ 5 = $268 ÷ 5 = $53.60.
- EMA: ($52 − $53.67) × 0.3333 + $53.67 = −$0.56 + $53.67 = $53.11.
On day 6 the EMA jumped $1.67 versus the SMA’s $1.40, because it puts a third of its weight on the newest close. On day 7 price fell $5, yet the SMA rose by $0.20: the $51 leaving the window was lower than the $52 entering it. The EMA fell $0.56, reflecting the drop immediately. That is the practical difference between the two in miniature.
Moving Average vs Exponential Moving Average: Key Differences
| Feature | Simple moving average (SMA) | Exponential moving average (EMA) |
|---|---|---|
| Weighting | Equal weight to every price in the window | More weight on recent prices, declining exponentially |
| Data used | Only the last N prices | All past prices, with fading influence |
| Response to a sudden turn | Slower | Faster |
| False signals in ranges | Fewer | More |
| Drop-off effect | Yes, old prices leaving can move the line | Minimal |
| Common uses | 50- and 200-day trend filters, long-term investors | Short-term trading, 9-, 12-, 20- and 26-period settings, MACD |
Understanding lag
Lag is the delay between a change in price and the moving average reflecting it. Every average lags because it is built from past data. For an SMA, the average age of the prices in the window is (N − 1) ÷ 2 periods: about 24.5 days for a 50-day SMA and 99.5 days for a 200-day SMA. On a steady trend, the line trails price by about that much.
The EMA’s weighted average age works out to the same (N − 1) ÷ 2. Its advantage is not less lag on a steady trend but a faster first reaction after a sharp turn, because the newest prices carry the most weight. Shortening the period cuts lag for either type, but makes the line noisier.
The 50 and 200 Day Moving Average
The two most widely quoted moving averages are the 50-day (about ten weeks of trading) and the 200-day (about forty weeks, or most of a trading year). Both are usually simple averages of daily closes.
- Trend filter: price above a rising 200-day SMA is the most common definition of a long-term uptrend. Many investors and funds use it to decide whether to take risk at all.
- Dynamic support and resistance: in an uptrend, pullbacks often pause near the 50-day line. Because so many traders watch these lines, reactions there can become self-fulfilling. Our guide to support and resistance explains how to treat such levels as zones.
- Distance as a gauge: a price far above its 200-day line signals a stretched market; one far below signals a deeply oversold one. Neither tells you when the stretch will end.
Golden cross and death cross
A golden cross occurs when the 50-day moving average crosses above the 200-day. A death cross occurs when the 50-day crosses below the 200-day. Financial media report both heavily, especially for major indexes such as the S&P 500.
Keep their limits in mind. Because the 50-day trails price by roughly 25 days and the 200-day by roughly 100, a death cross often arrives after much of a decline has already happened, and a golden cross after much of the rebound. In a sideways market, the two lines can cross back and forth several times in a few months.
Moving Average Crossover Strategies and the Whipsaw Problem
A crossover strategy buys when a faster average crosses above a slower one and sells (or shorts) when it crosses below. Common pairs include 9/21 EMA for short-term charts, 20/50 for swing trading and 50/200 for long-term trend following. A simpler version uses price itself: buy when price closes above the average, sell when it closes below.
These systems share one strength and one weakness. In a long trend they keep you in the move and get you out eventually, which limits large losses. In a sideways market they produce whipsaws: a buy signal followed quickly by a sell signal at a lower price, again and again.
Example: Suppose a stock starts the year at $100 and drifts sideways for nine months before trending up to $112. A 20/50-day crossover system on 100 shares produces four round trips:
- Trade 1: buy $104, sell $99 = −$5.00 per share
- Trade 2: buy $103, sell $100 = −$3.00
- Trade 3: buy $102, sell $98 = −$4.00
- Trade 4: buy $101, still held at $112 = +$11.00
Net: −5 − 3 − 4 + 11 = −$1.00 per share, or −$100 on 100 shares. Add spread and slippage of $0.05 per share on each of 7 executions (4 buys, 3 sells) and the result is −$100 − (7 × $0.05 × 100) = −$135.
Holding the same 100 shares from $100 to $112 would have gained $1,200. The system was right about the trend in the end, but the whipsaws in the range cost more than the trend paid.
Traders reduce whipsaws in several ways, each with a trade-off:
- Longer periods: fewer false signals, but later entries and exits.
- A confirmation filter: require a close a set percentage beyond the average, or two consecutive closes. This removes small crosses but also delays real ones.
- A trend-strength or volatility check: skip crossovers when the slower average is flat.
- Trading only in the direction of the higher timeframe: for example, take bullish 20/50 crosses only when price is above the 200-day.
Warning: Backtests of crossover systems often look excellent on the one market and period they were tuned on. Change the dates or the asset and the edge frequently disappears. Include realistic costs in any test, and be skeptical of settings chosen because they produced the best historical result.
A Moving Average Strategy for Beginners
If you want a starting framework rather than a black-box signal, combine a slow average for direction with a faster one for timing:
- Trend filter: on the daily chart, only look for long trades when price is above a rising 200-day SMA.
- Pullback zone: wait for price to pull back toward the 20-day or 50-day EMA instead of chasing strength.
- Trigger: enter when a bullish candle closes back above the faster EMA, ideally near a horizontal support zone.
- Stop: place it below the pullback’s low, not at an arbitrary distance.
- Size: risk a fixed small fraction of your account, such as 1%, based on the distance from entry to stop.
- Exit: take partial profits at a target such as 2R, or exit on a daily close below the 50-day.
Pair the moving average with one momentum tool, such as the RSI indicator, if you want an extra check, and match the settings to your style. The day trading vs swing trading guide explains how holding period changes which timeframes make sense.
What the Research Says
- Early evidence was positive. Brock, Lakonishok and LeBaron (1992) tested simple moving-average rules on the Dow Jones Industrial Average from 1897 to 1986 and found that buy signals were followed by higher returns than sell signals.
- Later tests were less kind. Sullivan, Timmermann and White (1999) re-examined thousands of rules while correcting for data snooping, the problem of testing many rules and keeping the winners. They found the best rule from the original period did not deliver superior performance in the following decade.
- Reviews are mixed. Park and Irwin (2007) found many studies reporting profits for technical rules but flagged weaknesses in testing methods and weaker results in more recent data.
The honest takeaway: moving averages are a sound way to describe a trend and to define rules in advance, but they are not a reliable source of excess returns on their own, especially after costs.
Bottom Line
An SMA weights every price equally and moves smoothly; an EMA leans on the latest prices and turns faster. Use the 50- and 200-day lines to read the larger trend, treat golden and death crosses as late confirmations rather than forecasts, and expect crossover systems to bleed through whipsaws in sideways markets. Define your stop and position size before every trade, and keep learning with our trading guides.
Sources
- NIST/SEMATECH e-Handbook of Statistical Methods – EWMA Control Charts
- The Journal of Finance (via RePEc) – Brock, Lakonishok and LeBaron, Simple Technical Trading Rules and the Stochastic Properties of Stock Returns
- The Journal of Finance (via RePEc) – Sullivan, Timmermann and White, Data-Snooping, Technical Trading Rule Performance, and the Bootstrap
- Journal of Economic Surveys (via RePEc) – Park and Irwin, What Do We Know About the Profitability of Technical Analysis?
- FINRA – Frequent Intraday Trading
- CMT Association – Chartered Market Technician program
Frequently asked questions
Which is better: moving average vs exponential moving average?
Neither is better in every case. The EMA turns sooner after a change in direction, which suits short-term traders, while the SMA is smoother and less prone to false signals, which suits trend filters on daily and weekly charts. Pick one, test it on your market and timeframe, and stay consistent.
What do the 50 and 200 day moving averages tell you?
The 50-day average reflects the intermediate trend and the 200-day the long-term trend. Price above a rising 200-day is widely read as a long-term uptrend, and below a falling one as a downtrend. Because so many investors watch them, these lines often act as support or resistance.
What is a moving average crossover?
A crossover happens when a faster average crosses a slower one, or when price crosses an average. A fast line crossing above a slow line is a bullish signal, and crossing below is bearish. The 50-day crossing the 200-day, called a golden cross or death cross, is the best-known example.
What is a good moving average strategy for beginners?
A simple approach is to use the 200-day SMA as a trend filter, only looking for long trades when price is above it, and the 20- or 50-day EMA as an area to buy pullbacks. Combine it with a fixed stop-loss and a small, fixed risk per trade. Test it on paper first, because no moving-average rule works in every market.
What does a golden cross mean?
A golden cross occurs when the 50-day moving average crosses above the 200-day moving average. It shows that the intermediate trend has turned up relative to the long-term trend. Because both lines lag, the cross often arrives well after the low, and it can reverse in sideways markets.
Why do moving averages lag?
Every moving average is built from past prices, so it can only change after price has already moved. On a steady trend, an N-period average trails by about (N − 1) / 2 periods, roughly 100 trading days for a 200-day average. Shorter periods and exponential weighting reduce the delay but increase noise.
Keep learning
Support and Resistance Explained: How to Draw and Trade Them
Support is a price zone where buying has repeatedly stopped declines; resistance is where selling has capped rallies. Here is…

Candlestick Patterns for Beginners: 16 Patterns and What They Mean
Candlestick patterns are one-, two- or three-candle shapes that show how buyers and sellers fought over a period. Learn 16…

Technical Analysis for Beginners: The Complete Starter Guide
Technical analysis uses price and volume charts to judge probable market moves and plan trades with a set entry, stop…